


1 Debugging and ATMELStudio
https://www.youtube.com/watch?v=wQZKWgnmvQ8
Table of Contents
-
1.1 Video Tutorial
-
1.2 New Project
-
1.3 Debug Windows
-
1.4 Debug Commands
-
1.6 Stimulifile
1.1 Video Tutorial
1.2 New Project
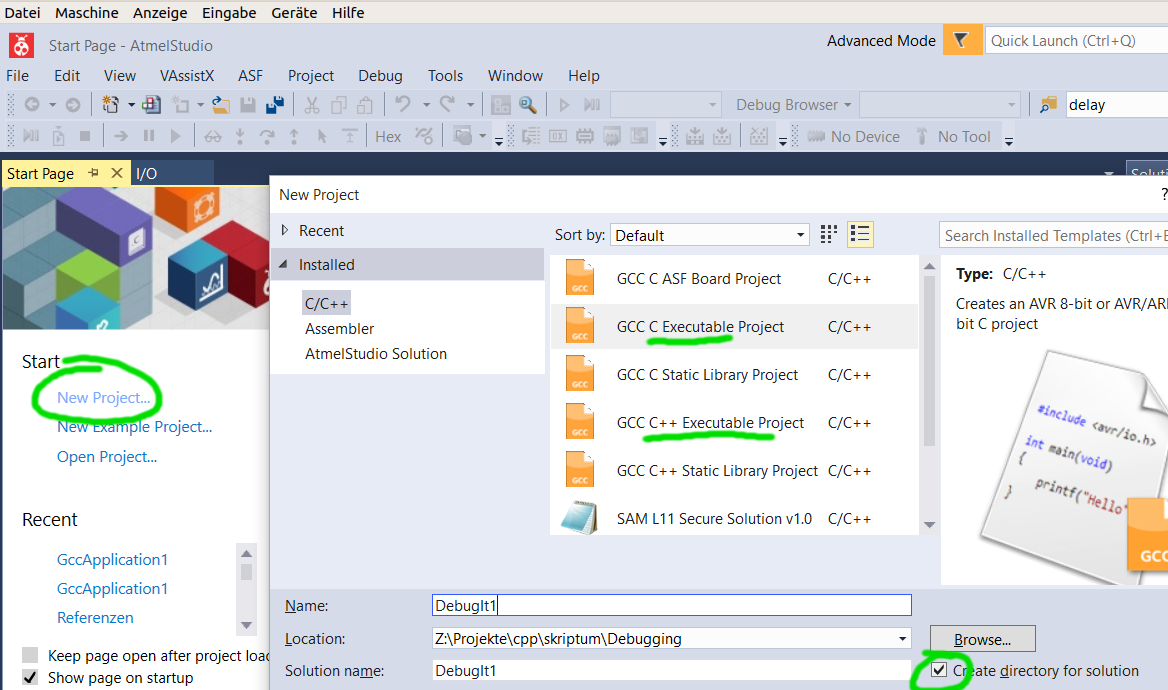 Select your Processor (e.g. Atmega328p)
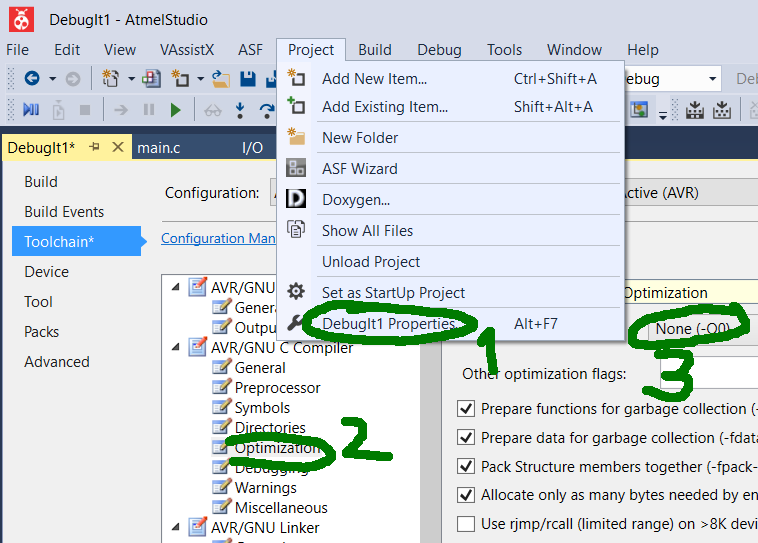
Properties
Menu //Project/Properties
Toolchain
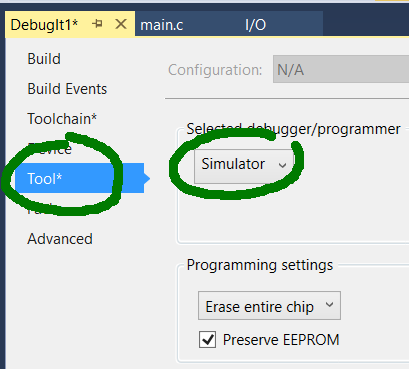
Simulator
1.3 Debug Windows
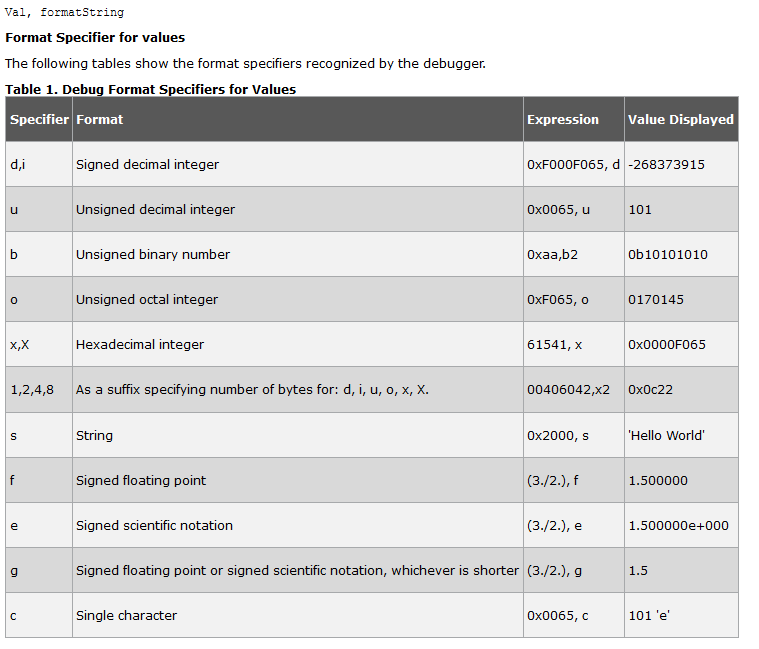
Watch
Shows Variables, Add Watch to control value and address
Edit in Watch Window to output in various formats e.g. PINB,d to display char* text1 = ″Hallo″; use text1, s in Watch window
IO
Shows IO Devices
Add multiple IO devices by CTRL+Click
Processor Status
Shows Registers and Processor Cycles/Stopwatch
Dialog to control simulation clock frequency
Reset stopwatch/cycle counter (right click)
Memory
Display and Edit Memory Content
Disassembly
Display OpCode
1.4 Debug Commands
-
Run
run to next break point -
Step Over
step functions as one line of code -
Step Into
step into functions -
Step Out
step one level up -
Reset
like hardware reset -
Break
break to later continue -
Stop
stop simulation (source code changed)
1.5 Breakpoints and Tracepoints
Breakpoint
Start Debugging and Break
Breakpoint/Insert Breakpoint/Toggle Breakpoint or Double Click on left gray window frame
Conditional Breakpoint
set a condition and display a message when breakpoint was hit
stop execution
Tracepoint
set a message when tracepoint was hit
continue execution; needed to trace program execution (wherever I've been)
Data Breakpoint
use a static variable (heap address) and monitor its state; control number of hits of this breakpoint by right click on the databreakpoint
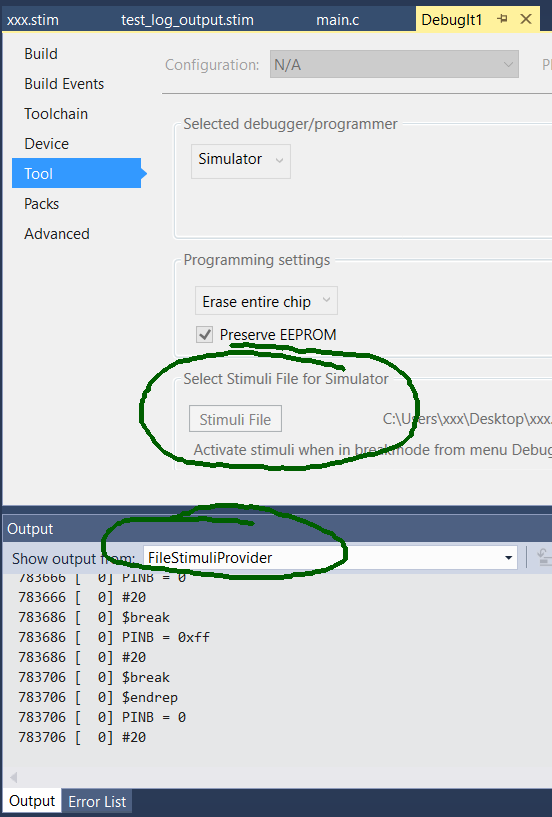
1.6 Stimulifile
A stimuli file (name.stim) is used to change PIN inputs, log information und stop execution automatically.
Set Stimulus File and execute it
1. Set Stimulus File in Project/Preferences
2. //Debug/Start Debugging and Break
3. //Debug/Execute Stimulifile
Stimulifile example
Example 1
//sets port B, waits 20 cycle and stops execution – resum it
$repeat 2000000
PINB = 0
#20
$break
PINB = 0xff
#20
$break
$endrep
Example 2
write a logfile
$log PORTB
$log PINB
$log SP
$startlog logfile.stim
$reset
PINB = 0x55
#10
PORTB = 0x99
#10
$break
PORTB |= 0xFF
#10
$stoplog
$break
1.7 Conditional Compiling
Another method for debugging is the use of a display/serial port and conditional compiling. The symbol DEBUG is set automatically when in Debug perspective.
#ifdef DEBUG
Serial.write(x);
#endif